Global Student Flows 🌏 Malaysia’s International Student Shifts The QS Global Student Flows Malaysia report explores shifting student flows, emerging source markets, and reputation challenges, outlining strategies to sustain institutional growth and competitiveness.
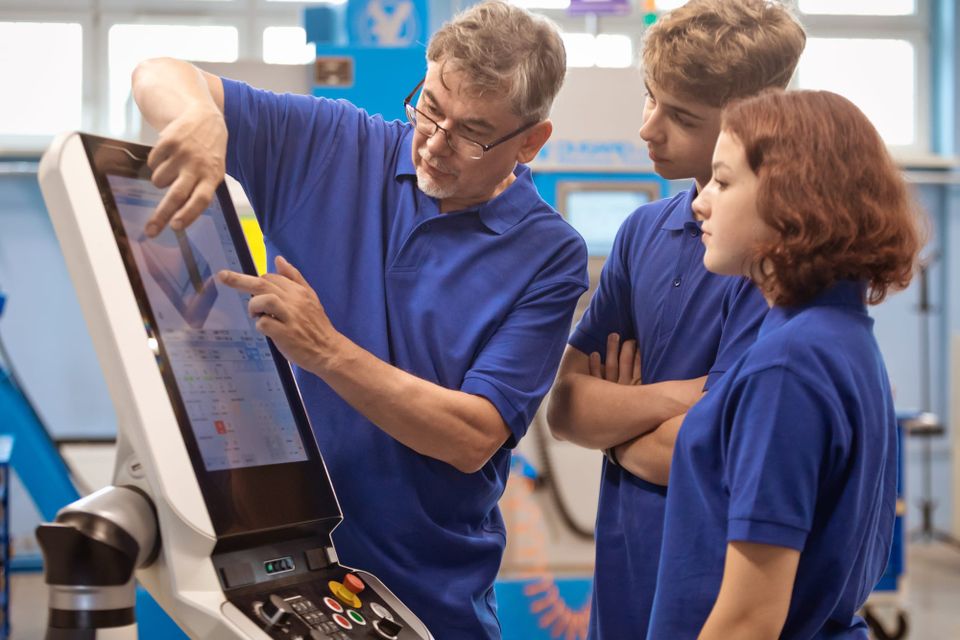
Skills & Workforce 🛠️ Skills and Workforce #61 QS Skills newsletter explores global labor trends, reskilling initiatives, and workforce gaps across impact sectors. Dive into the latest insights on Green Skills, Advanced Manufacturing, AI and Digital, and Health Skills.
Charts 👶 NYC infant childcare is the Priciest. US industrial gas use is rising. NVIDIA leads the semiconductor market. Chart of the Day #527 Looks at New York city childcare costs, US natural gas consumption, and largest semiconductor companies.
Charts 🤖 Latest AI models yet to master new benchmarks. Aus lagged research funds. US led health spending per capita. Chart of the Day #526 looks at Australia’s state funding for research, global healthcare spending per capita, and latest AI benchmarks.
QS Mid Week Brief What signals should higher education leaders be paying attention to in 2026? QS Midweek Brief - January 21, 2026. How should leaders make choices? And how do they move from cosmetic to structural changes?
Charts 💼 Indian e-commerce expands gig economy. Google spent $200M on Gemini 1.0 Ultra. Indian city pollution. Chart of the Day #525 looks at Indian e-commerce, air quality in Indian cities, and AI model training costs.
Charts 🍃 China with 60% of the world's mega dams. Canada’s R&D spending on HE. South Africa tops platinum production. Chart of the Day #524 looks at higher education in Canada, the largest dams by installed energy capacity, and the top platinum-producing countries.
Charts 👶 Home childcare hits 30%. Singapore tops health index. Apple trails smart speakers market share. Chart of the Day #523 looks at US childcare, healthiest countries in the world, and smart speaker market share.
Charts 💼 Hamburg and Berlin labour at >60%. US records highest particulate matter pollution. China leads manufacturing. Chart of the Day #522 looks at labour force in major cities, criteria of air pollutants, and global manufacturing growth.
Charts 🍃 Eco-Friendly Products Remain Expensive. EdTech Seed Funding Rises. US AI Investment 4× Global Average. Chart of the Day #521 Looks at Global Funding in Edtech, Barriers to Sustainable Practices, and a Comparison of US and Global AI Investment.
Charts 🏫 More Students Prefer Gamified Learning. Gym Enrolments Peak in January. The US Led AI Startups. Chart of the Day #520 Looks at EdTech Sector Growth, Gym Membership Trends in the US, and Global AI Startups.